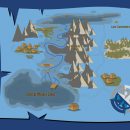
Creating a Customer Journey Map (or how your customers got to you and bringing them back again)
You know how important it is to create memorable experiences for customers and to solve any problems that arise. However the customer is more likely to have a complex customer journey with your brand than in the past. The ways in which they can discover you and make a purchase expands across multiple platforms, or omni channels, making it more difficult for you to keep track of their experiences.
What you can do to get an understanding of how your customers are encountering your brand in such places as your website, social media channels, email campaigns and in communications with your staff is to visualise their journey as a map, identifying all the points they encounter your business. It doesn’t have to be an epic tale of hobbits, dragons and lonely mountains but it does have to be a story that will help your customers to reach a happy ending and hopefully return for a sequel.
In your story you are breaking down the plot points to show the problems your customers experience along their route. You will be able to identify any gaps in communication. Are your social media users able to easily switch over to your website? Is there a delay in the passing on of information between departments in the business? Is your after sales customer care as good as it can be?
How do you create this story map? First of all decide whether you want to map a broad overview of the journey and customer experience or to focus on one specific area you feel needs investigation. Then you need to put yourself into the characters/customers shoes to understand their expectations as they progress and predict where they are likely to go next.
Where are the best places to gather data to help with plotting your map? Social media channels are useful. You can make the most of social listening to see what the audience is saying about your area of expertise. Customer surveys can also be conducted, staff can provide information on the most asked questions and Google Analytics will give you many insights into the users route around your website.
Once you have gathered your data you need to convert this information into a visual format, whether that’s an excel sheet or an infographic it needs to be in a form everyone in the company can share and use.
As Bilbo Baggins himself said: “Only Thing To Do! On We Go.”
