Knight Frank: Occupier market stats point to signs of stabilisation, but challenges remain.


Knight Frank: Occupier market stats point to signs of stabilisation, but challenges remain.
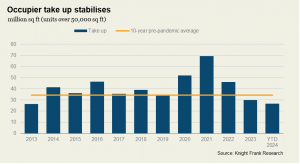
Across the UK, occupiers took up 9.4 million sq ft of industrial and logistics floorspace in Q3 2024. While this figure is slightly below the previous quarter (9.5 million sq ft), it exceeds the average quarterly totals recorded over the past couple of years and brings total take up for 2024 (Q1-Q3) to 26.7 million sq ft.
However, challenges remain in the occupier market and there are nuances among the nine regional markets in terms of requirements and supply. Macroeconomic and political challenges continue to weigh on occupiers, while the impending new Labour government’s Autumn budget is adding an additional degree of caution to their decision-making processes.
That said, the year-to-date total is now just 10% below the annual total for 2023 of just under 30 million sq ft. Given the volume of floorspace currently under offer, we expect 2024 occupier take up to reach or even exceed last year’s figure. With the economic outlook improving, and inflationary pressures of the past year starting to ease, this may lead to improved take up in the coming quarters.

Vacancy rate rises further
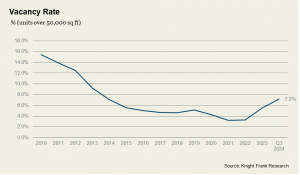
The vacancy rate rose from 6.9% at the end of last quarter to 7.2%. Much of the space currently available is within second-hand units, while 27% of all second-hand space comprises good-quality, modern Grade A stock.
Whilst levels of availability have risen across the UK over the past two years, some regions have fared better than others. Certain unit sizes in parts of certain regions remain in short supply, while several units available fall short of the fit-out and amenity requirements of many modern occupiers. The most significant rise in vacancy has been recorded in the South Yorkshire region. Two years ago, vacancy rates here were just 2.1%; they have risen to 11.5%. In the Midlands, vacancy rates have risen from 1.8% to 6.1%. But despite the uplift in availability in these markets, certain unit sizes in parts of these regions remain in short supply. In Wales and Scotland, vacancy rates have risen more modestly. Two years ago, Wales had a vacancy rate of 10.3%, compared with 12.4% currently, while in Scotland, the vacancy rate has risen to 4.8%, from 4.4% two years ago.

Reduced development activity
The number of developments underway, particularly speculative development starts, have fallen. Across the UK, a total of just 22 million sq ft is expected to complete in 2024, down from 33.2 million sq ft completed last year and 37.2 million sq ft the year before.
There is currently 14.5 million sq ft under construction and expected to complete in 2025. This figure is likely to rise, given that we have yet to reach the end of 2024 and the relatively short construction timelines for industrial units. However, construction cost pressures, high financing costs, along with political and economic uncertainty, continue to impact appetite for new development.
The short-term development pipeline is particularly constrained in some regional markets and this is placing continued upward pressure on prime rents. In Wales, there is currently no speculative development of units over 50,000 sq ft underway, with only a handful in West Yorkshire & the Humber, the South West, the North East and Scotland. The lack of new-build development has left the North East and Scotland occupier markets largely dominated by second-hand units as occupiers increasing rely on second-hand stock. Over the past four quarters, 84% of take up in Scotland has comprised second-hand space, with only two transactions completing on high-quality new builds, while in the North East, second-hand space accounts for 90% of annual take up. While robust demand is being seen for the limited number of new developments that are being delivered, challenges in the development market means that the majority of take up and supply in the North East and Scotland will continue to be centred around older units, at least for the short-term.
Below are the key takeaways from the nine regional industrial & logistics occupier markets from the Q3 2024 reporting period. Further insights on both occupier and investment markets within each region can be found at these links:
London & South East: Prime rents in West London rose to £30 psf in Q3 despite increased supply and moderated take up.
LOGIC: London & South East – Q3 2024 | Knight Frank Research
Midlands: Speculative development is 17% lower annually at 4.5 million sq ft, with parts of the region facing limited supply.
LOGIC: Midlands – Q3 2024 | Knight Frank Research
North West: Take up for the year-to-date is 43% ahead of the same period last year.
LOGIC: North West – Q3 2024 | Knight Frank Research
South Yorkshire & North East Derbyshire: Supply in part of the region remains limited despite rising availability, with only two new-build options in Sheffield.
LOGIC: South Yorkshire – Q3 2024 | Knight Frank Research
West Yorkshire & the Humber: YTD take up at a three-year high of 1.9 million sq ft, surpassing the annual totals for both 2022 and 2023.
LOGIC: West Yorkshire – Q3 2024 | Knight Frank Research
South West: One-third of existing availability is under offer, the majority (72%) of which comprises new units.
LOGIC: South West – Q3 2024 | Knight Frank Research
North East: A lack of new units means that second-hand space accounts for 83% of all available space and 86% of YTD take up.
LOGIC: North East – Q3 2024 | Knight Frank Research
Wales: The only two new builds are now under offer, with no further speculative development underway.
LOGIC: Wales – Q3 2024 | Knight Frank Research
Scotland: Vacancy rate fell for the third consecutive quarter, to 4.8%.
LOGIC: Scotland – Q3 2024 | Knight Frank Research
You can see all of the commercial property listed by Knight Frank on NovaLoca here.

[…] In October Knight Frank presented in-depth industrial and logistics occupier market stats highlighting signs of stabilisation amid challenges. […]